Inside the Go CPU profiler
How does the Go CPU profiler works under the hood?
Table of Contents
Go is one of its kind when it comes to profiling. It includes powerful and opinionated(!) profilers inside the runtime. Other languages like Ruby, Python, or Node.js, contains profilers or a few APIs for writing profilers. But they are limited in scope compared to what Go offers out of the box. If you want to learn more about the types of observability tools that Go provides, I highly recommend Felix Geisendörfer’s The Busy Developer’s Guide to Go Profiling, Tracing and Observability
As a curious engineer, I love to dig deep into how things work at a lower level, and I have always wanted to teach myself how the Go CPU profiler works under the hood. This blog post is the result of that journey. I always find myself learning new things when I read Go runtime, and this was no exception.
Basics
There are two types of profilers:
- tracing: do measurements whenever a pre-defined event happens. e.g., function called, function exited…etc.
- sampling: do measurements at regular intervals.
Go CPU profiler is a sampling profiler. There is also a Go execution tracer which is tracing profiler and traces certain events like acquiring a Lock, GC-related events…etc.
Sampling profilers usually consist of two essential parts:
- sampler: a callback is called at regular intervals, and a stack trace is usually collected by profiling data. Different profilers use different strategies to trigger the callback.
- data collection: this is where the profiler collects its data: it might be memory consumption or call count, basically any metric associated with a stack trace.
A small survey on how other profilers work
Linux perf uses PMU(Performance Monitor Unit) counters for sampling. You instruct the PMU to generate an interrupt after some event happens N times. An example might be to tick in every 1000 CPU clock cycles. A detailed article written by Denis Bakhvalov explains how tools like Linux perf and VTune use PMU counters to make this happen. Once the data collection callback is triggered at regular intervals, all is left to collect stack traces and aggregate them properly. To be complete, Linux perf uses perf_event_open(PERF_SAMPLE_STACK_USER, ...) to obtain stack trace information. The captured stack traces are written to userspace via mmap’d ring buffer.
pyspy and rbspy are famous sampling profilers for Python and Ruby. They both ran as external processes and periodically read the target application memory to capture the stack trace of running threads. In Linux, they use process_vm_readv, and if I am not mistaken, this API pauses the target application for a few milliseconds during memory read. Then they chase pointers inside the memory they read to find the currently running thread structure and stack trace information. As one might guess, this is an error-prone and complex approach but works surprisingly well. pyflame uses a similar approach too.
Recent profilers like Parca(there are few others) use eBPF. eBPF is a recent technology that allows to run userland code in the Kernel VM. It is a brilliant technology that is used in lots of areas like security, networking, and observability. I highly suggest reading some information on eBPF; it is a massive topic that goes well beyond the scope of this blog post.
How the profiler is triggered periodically?
Go CPU profiler is a sampling profiler. In Linux, Go runtime uses setitimer/timer_create/timer_settime APIs to set up a SIGPROF signal handler. This handler is triggered at periodic intervals controlled by runtime.SetCPUProfileRate, which is 100Mz(10ms) by default. As a side note: surprisingly, there were some serious issues around the sampler of the Go CPU profiler until Go 1.18! You can see the gory details on these problems here. The setitimer API was the recommended way of triggering time-based signals per-thread in Linux, but it was not working as advertised. Please feel free to correct me if this claim is wrong. (Felix Geisendörfer corrected this claim): Technically it works as you’d expect from a process-directed signal mechanism. But it’s not a good mechanism for multicore profiling.
Let’s see how you can enable the Go CPU profiler manually:
f, err := os.Create("profile.pb.gz")
if err != nil {
    ...
}
if err := pprof.StartCPUProfile(f); err != nil {
    ...
}
defer pprof.StopCPUProfile()
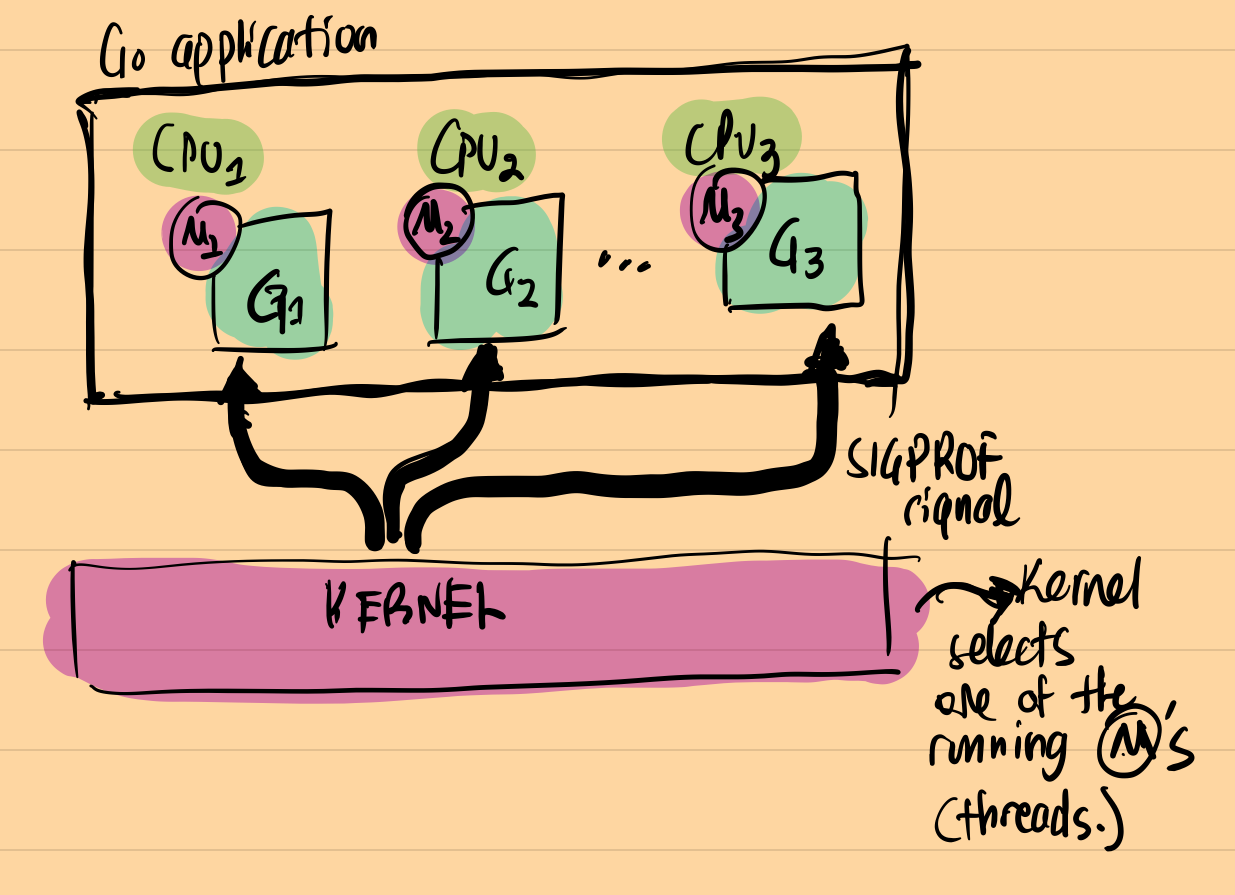
Once pprof.StartCPUProfile is called, Go runtime enables the SIGPROF signal to be generated at specific intervals. The kernel sends the signal signal to one of the running threads in the application. Since Go uses non-blocking I/O, goroutines waiting on I/O are not counted as running, and the Go CPU Profiler does not catch these. As a side note: this was the basic reason why fgprof was implemented. fgprof uses runtime.GoroutineProfile to obtain both on and off-CPU goroutines.
A picture is worth a thousand words; below is how Go runtime handles SIGPROF signal:
How profiler collects data?
Once, a random running goroutine receives a SIGPROF signal, it gets interrupted and signal handler runs. The stack trace of the interrupted goroutine is retrieved in the context of this signal handler and then saved into a lock-free log structure along with the current profiler label(Every captured stack trace can be associated with a custom label which you can later do filtering on). This special lock-free structure is named as profBuf and it is defined in runtime/profbuf.go with a long and detailed explanation on how it works. It is a single-writer, single-reader lock-free ring-buffer structure which resembles the one published here. The writer is the profiler signal handler and the reader is a goroutine(profileWriter) that periodically reads this buffer and aggregates results to a final hashmap. This final hashmap structure is named as profMap and defined in runtime/pprof/map.go
Here is a simple visualization on how this all fits together:
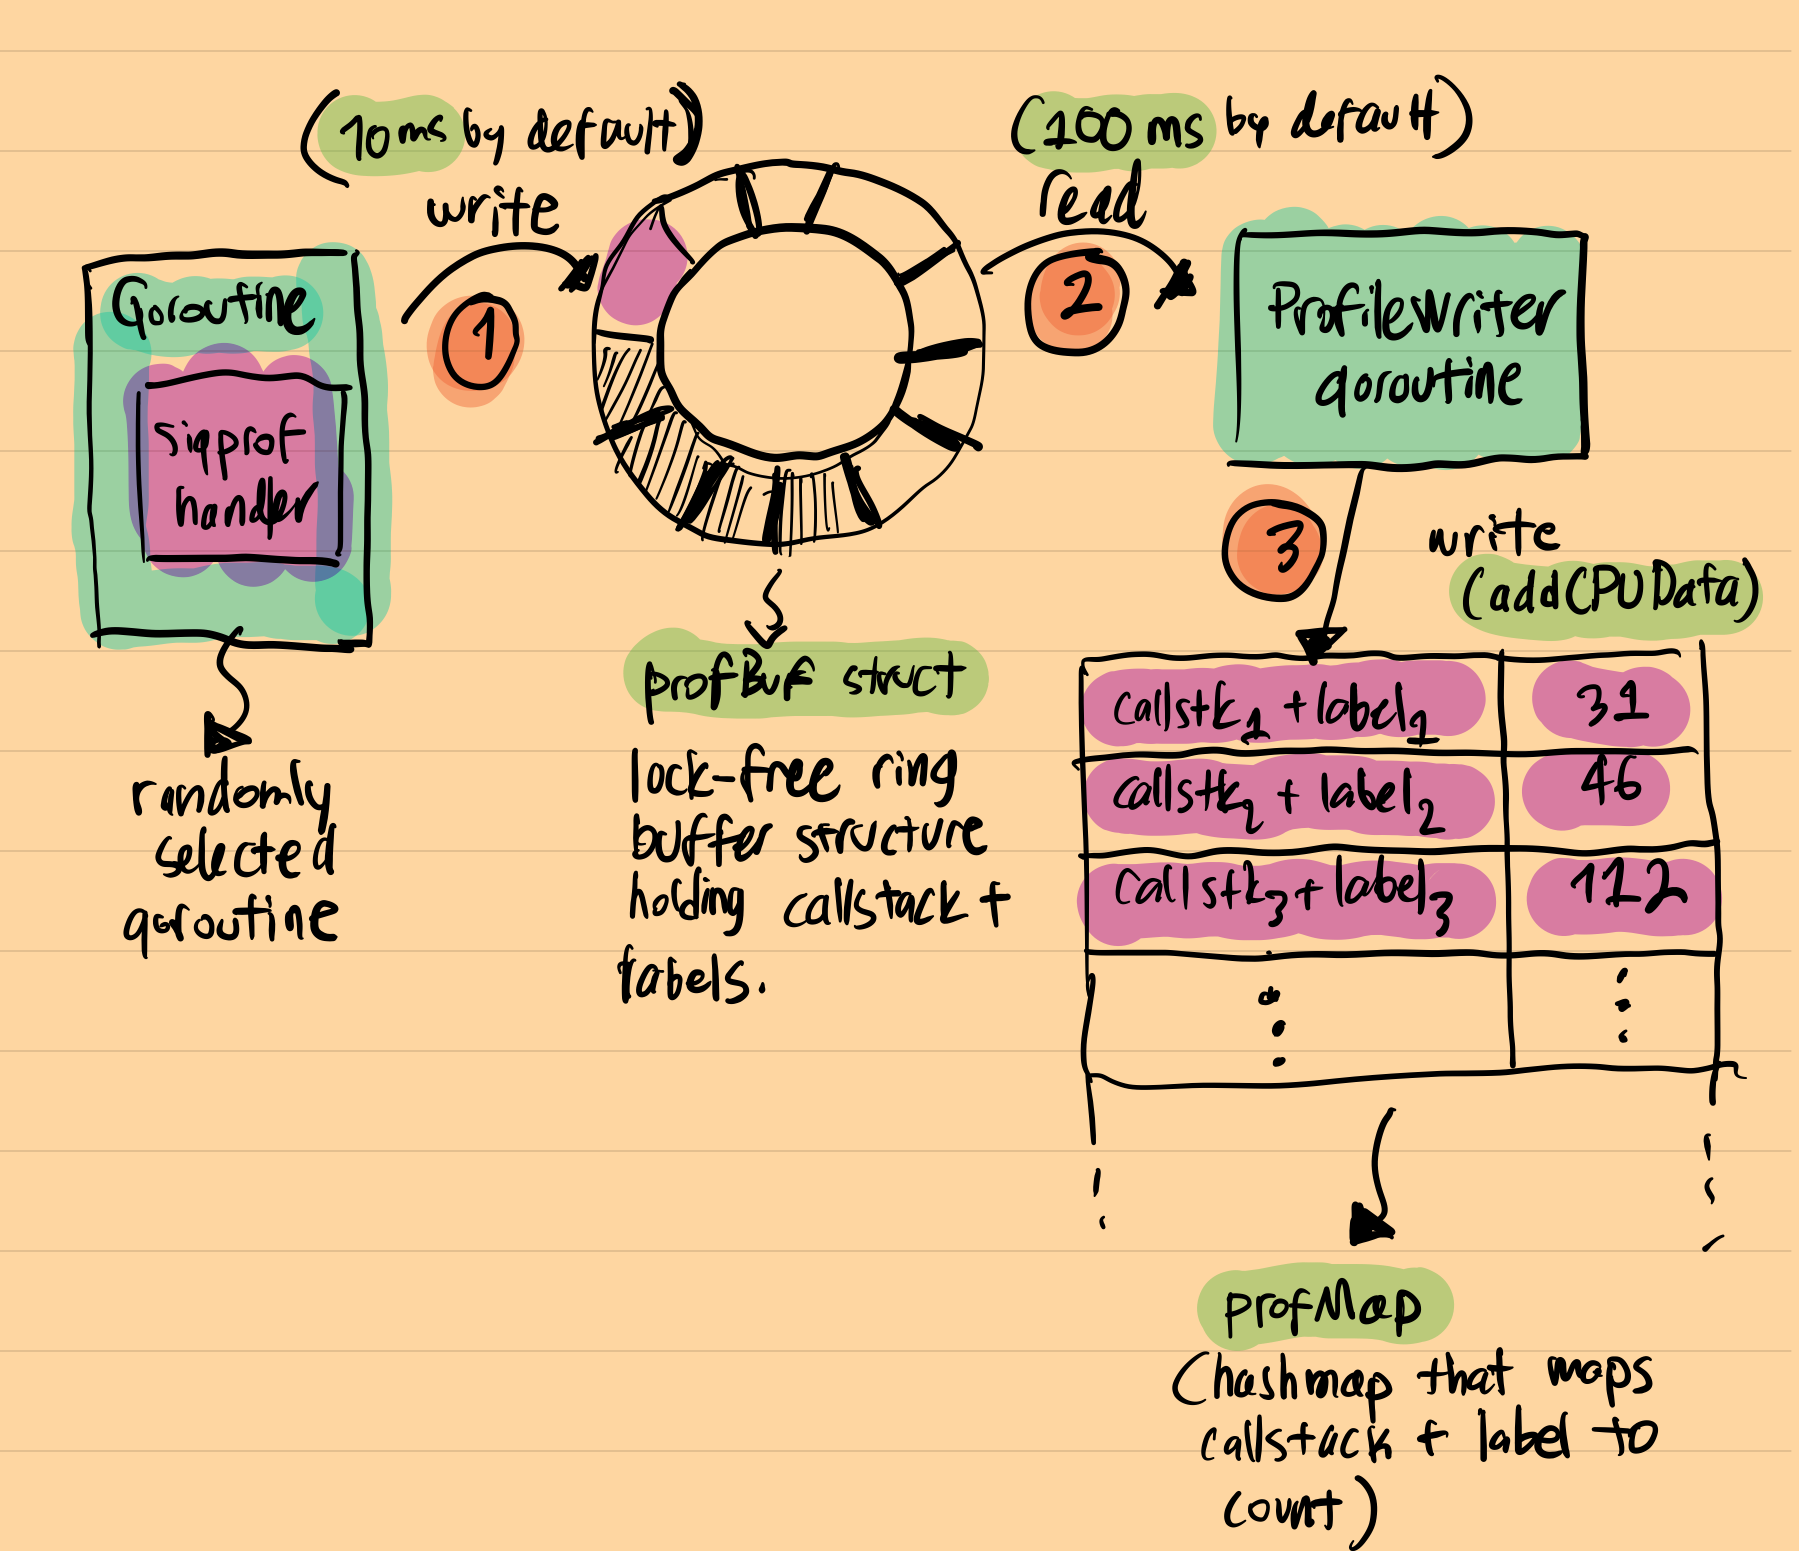
As can be seen, the final structure resembles the regular pprof.Profile object a lot: it is a a hashmap where the key is stack trace + label and the value is the number of times where this callstack is observed in the application. When pprof.StopCPUProfile is called, profiling stops and profileWriter.build gets called. This function is responsible for writing this profMap structure to the io.Writer object that is provided in the initial pprof.StartCPUProfile call. This is where the final pprof.Profile object is generated.
Pseudocode for profileWriter might be helpful here:
func profileWriter(w io.Writer) {
    ...
    for {
        time.Sleep(100 * time.Millisecond)

        data, tags := readProfile()
        if e := b.addCPUData(data, tags); e != nil {
            ...
        }

        if profilerStopped {
            break
        }
    }
    ...
    b.build() // -> generates final pprof.Profile
    ...
}
Why Go took all the trouble for implementing a unique lock-free structure just for holding temporary profiling data? Why not write everything to a hashmap periodically?
Look at the first thing that the SIGPROF handler does is to disable memory allocation. Additionally, the profiler code path does not involve any locks and even the maximum depth of stack trace is hardcoded. As of Go 1.19, it is 64. All these details are there to provide a more efficient and predictable overhead for the profiler. Low and predictable performance is key for a production-ready profiler.
Overhead
Based on the design, should the profiler overhead be constant? Well, it depends. Let me explain why: in a single profiler interrupt, the following happens:
- a random running goroutine context switch to run the
SIGPROFhandler code, - stack walk happens, and Go runtime saves the stack trace to a lock-free ring buffer,
- the goroutine is resumed.
In theory, it seems like all above should run in constant time as no allocation and locks are happening. While I could not find the reference, I remember all the And this is true: all above happens in around ~~~10 nanoseconds~~ ~1 microseconds (on a typical CPU)(Corrected by Felix Geisendörfer). But, in practice, it becomes much worse. If you search for the “overhead of the Go CPU profiler”, you will see numbers ranging from %0.5 to %1-%5 and even %10(no public mention was found on this number and no emprirical evidence, too). The reason behind this is mostly related to how CPUs work. Modern CPUs are complex beasts. They cache aggressively. A typical single CPU core has three layers of cache: L1, L2, and L3. When a specific CPU-intensive code is running, these caches are highly utilized. High cache utilization is especially true for some applications where small(data that can fit in cache) and sequential data is read heavily.
An excellent example of this is matrix multiplication: during matrix multiplication, CPU heavily accesses individual cells which are sequential in memory. These kinds of cache-friendly applications might produce worst overhead for a sampling profiler. While it is tempting to do some benchmarks with perf to verify this claim, it is beyond the scope of this blog post.
Having said the above, Go runtime has done a great job of keeping the profiler overhead as predictable and as low as possible. If you don’t believe me, which you should not, maybe below quote from a discussion thread can convince you:
At Google, we continuously profile Go production services, and it is safe to do so.
And another one is from a commit from DataDog’s continuous profiler implementation to make the profiler always be enabled:
After testing this default on many high-volume internal workloads, we’ve determined this default is safe for production.
And as a final note, based on the above theory, we can make following observation:
The profiler overhead will be minimum on typical I/O bound applications.
This is because CPU cache trashing does not make much difference when there are many sleeping/idle goroutines. We have observed this over and over during our Go CPU profiler benchmarks– there is literally zero (or statistically insignificant) overhead on typical I/O bound applications. Providing empirical evidence is beyond the scope of this blog post. One way to do it might be to observe the throughput during load testing with the profiler on and off.
Conclusion
One aspect I admire about this design is how it showcases the power of optimization when you deeply understand the access patterns of your underlying data structures. For instance, the Go runtime leverages a lock-free structure, which might seem like overkill for most situations. Yet, this choice reflects the depth of thought behind Go’s performance strategies. The runtime is filled with similar clever optimizations, and I highly recommend exploring the parts that capture your interest.
References
- https://github.com/DataDog/go-profiler-notes/blob/main/guide/README.md
- https://easyperf.net/blog/2018/06/01/PMU-counters-and-profiling-basics
- https://www.instana.com/blog/go-profiler-internals/
- https://www.datadoghq.com/blog/engineering/profiling-improvements-in-go-1-18/
- http://www.cse.cuhk.edu.hk/~pclee/www/pubs/ancs09poster.pdf
- https://easyperf.net/blog/2018/06/01/PMU-counters-and-profiling-basics