May thy bits chip and shatter: Patterns for Building High-Performance Observability Pipelines at Scale
Emerging patterns for building scalable, high-performance observability pipelines
Table of Contents
Motivation

As seen from the title, I’m a huge Dune fan. Much like sandworms lurking beneath the surface, ready to appear unexpectedly, the scale and complexity of observability data can be just as massive, unpredictable, and a little terrifying.
“But I do see a way. There is a narrow way through.”– Paul Muad’Dib Atreides, Dune Part Two
Sci-fi analogies aside, designing high-throughput observability data pipelines is a fascinating intersection of datastore design and architecture, packed with unique challenges.
I’ve always wanted to explore, an ever-evolving topic as a whole. To keep pace, I plan to make additional parts to this topic.
That also means if you have additional insights or corrections, I’d love to hear them—whether it’s expanding on what’s here or diving into something I’ve missed.
Anatomy of Telemetry Data
Real-world telemetry data includes a wide range of signals that help monitor and understand system behavior.
According to OpenTelemetry, the three core pillars of observability are metrics, traces, and logs. Additionally, a fourth pillar—continuous profiling—is emerging to enhance observability further(See this for more).
Given the complexity of modern workloads, telemetry data is inherently rich with entropy.
For instance, every HTTP trace includes a unique request-id, enabling users to query TBs of data based on a single identifier. This request-id might also link to continuous profiling data, allowing users to identify and debug performance bottlenecks by analyzing detailed flamegraphs, such as those for P99 HTTP requests.
All these telemetry data with their diverse characteristics, interlinked with each other, originating from various services across multiple clusters, converge into a single endpoint, posing significant challenges for observability vendors.
Let’s walk over some of these characteristics:
High volume, bursty ingress: I think it should come as no surprise that observability data is generated in overwhelming volumes. This is especially true with the modern cloud era and increasing computer power.
One other less mundane characteristic of telemetry data is that it usually comes in unpredictable, massive bursts.
So, the write path of an observability data pipeline should be highly scalable from the start to handle this type of bursty write load. This is why we see some common emerging patterns on handling this type of high-volume insertions on the database level(see LSM tree and Clickhouse’s MergeTree engine for example) - we will touch more on Write Distribution later on Ingestion.
High dimensionality: Think about an
HTTPtrace. It can have many dimensions(s) depending on the complexity of the infrastructure:trace-id, Kubernetes cluster/pod id, method, size, status code, timestamps, microservice names, URL, host, scheme, user-agent, you name it. The dimensions keep on going and queries might target any of these dimensions.
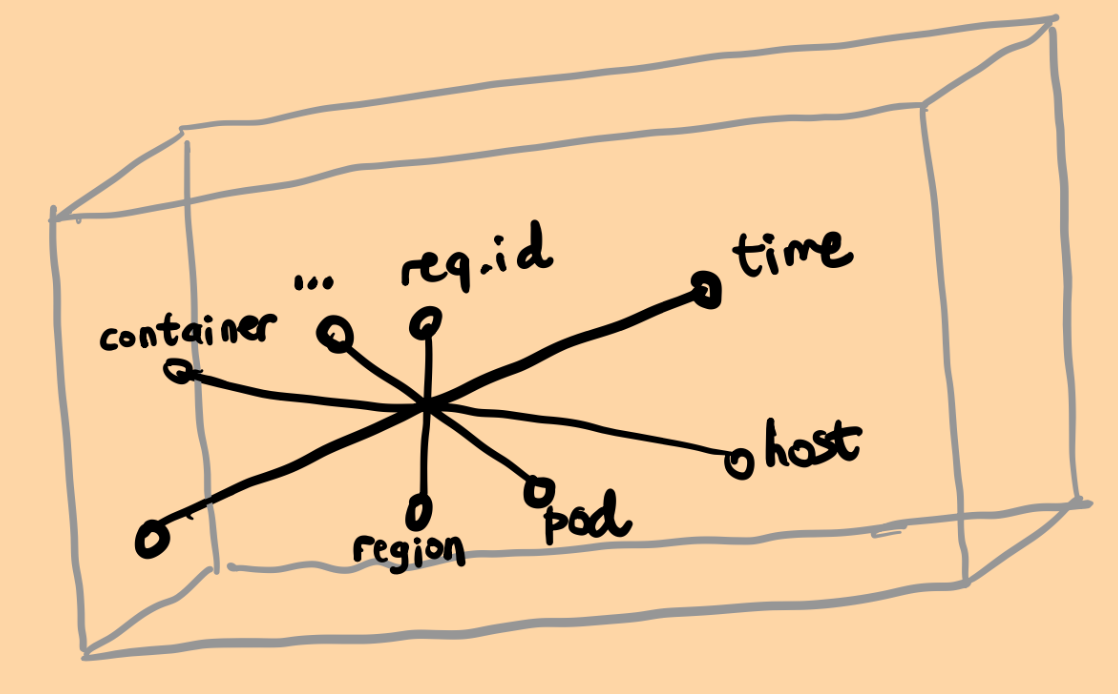
- High cardinality: Some dimensions in telemetry data can have high cardinality. Querying based on high-cardinality fields like
user-idorrequest-idcan be incredibly valuable for debugging complex production issues. However, scaling high-cardinality fields in traditional time-series databases is notoriously difficult as we will touch soon.
For more information on this topic, please check out this and this.

Unstructured or semi-structured data: The demand for dimensions in telemetry data is growing, in unstructured nature.
For instance, OpenTelemetry defines a custom LogAttributes field in its Clickhouse Log exporter to accommodate such needs, storing an arbitrary number of key/value pairs in a Clickhouse Map column.
Temporality: It is highly unlikely that telemetry data older than a month will be accessed. Most of the time, only recent data, spanning a few hours or a few days is queried. In fact, we can even say that the likelihood of the data being accessed drops exponentially with time.
This is also an important characteristic of telemetry data as this means caching would have enourmous benefits. I remember DataDog achieves ~%98 cache hit rate with local caching of telemetry data in their event storage system.
Immutability: Telemetry data is written once and never modified. There are lots of features that benefit from this useful characteristic.
To name few examples:
- No need for to manage complexities of consistency and isolation levels,
- Easier cache management,
- Append-only writes have lower latency,
- Easier to compress,
- …
Key Requirements for Observability Data
Now that we’ve explored some characteristics of telemetry data, let’s outline a few unique functional requirements:
No or Minimal Pre-aggregation: While debugging production issues, whether performance-related or not, you’ll often make complex analytical queries with unknown predicates. These predicates are unknown because you may filter queries by various dimensions like host, container, region, or user ID. Such fine-grained queries are typically the most useful.
In other words, you cannot define indexes while designing the table structure as you basically don’t know them. This is especially true for logs.
Freshness: Ingested data should be queryable in real-time or with very low latency. This is critical for debugging outages or meeting alerting rules. Serious observability vendors should have SLOs to ensure data freshness.
“Fast” query times: Fast is highly subjective. However, we can say that the query should finish ideally in sub-seconds or in a few seconds at worst.
Here is how this is described in the Observability Engineering book from Honeycomb engineers:
If you submit a query and can get a cup of coffee while you wait for results to return, you’re fighting a losing battle with a tool unfit for production.
This is no easy task. First, as we discussed earlier, the filters or aggregates needed are not known until query time. Second, analytical queries demand extensive data reads.
For example, if you want to query error trends by region in your cluster over the past week, the system must read a vast amount of data. This is different from point queries like searching for specific trace IDs, which involve smaller, more targeted reads.
The infrastructure should be capable of handling these large-scale queries efficiently, avoiding sharp spikes in tail latencies. In other words, it needs to manage both the heavy workload of analytical queries and the lighter demands of point queries, ensuring smooth performance across the board.
Enough Retention: We mentioned in the Anatomy of Telemetry Data section that older data is unlikely to be accessed. And I have yet to encounter a scenario where I needed to read six-month-old telemetry data to debug an issue in my career. Maybe it might have use cases in long-term trend analysis or fulfilling regulatory requirements. To be honest, I’m not entirely sure.
I am reading a post from Observe that asks the users following question:
Does Long-Term retention matter?
And the answer was:
Nearly all users (94%) indicated that longer-term retention is important to them and 70% said it’s very important.
Ok, but how long is long-term? The term long-term can be interpreted very differently depending on the individual. That’s why I call it as “enough retention”—a duration that varies uniquely for each organization based on its specific needs and use cases.
Fortunately, as storing telemetry data in object stores becomes increasingly common, the cost of retention is becoming less of a concern.
Durability: Well, this is no surprise – Any serious datastore should be durable and reliable.
Observability data, however, is not only larger in scale but also more critical. Imagine being unable to debug production issues because your observability solution fails during an outage—the very moment you need it most.
Rethinking Storage: Beyond the Boundaries of Time-Series Databases
Telemetry data can be conceptually separated into three distinct pieces of information:
- Timestamp – to record when the event occurred.
- Tag(s)– to provide additional details about the event, often stored as key-value pairs.
- Value – to capture the specific measurement or observation.
For instance, when logging the latency of an HTTP request, we record the latency as the value, associate it with a timestamp, and include tags such as the host-name, region, maybe a request-id. These contextual details enrich the event and enable more precise analysis. While tags can be named differently across stacks(see Attributes in OpenTelemetry), their purpose remains the same: carrying contextual information about a measurement.
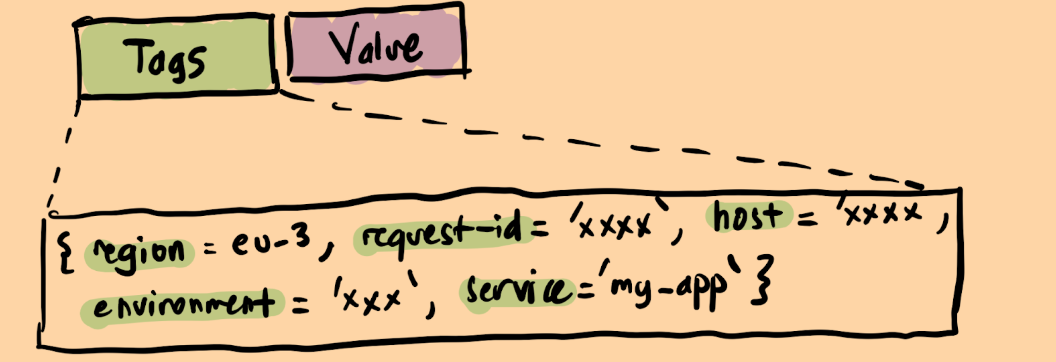
TSDB(Time-series database)’s fundamentally store information as key-value pairs, where the “key” encapsulates tags, and the “value” represents the time-series data.
Consider the following query:
SELECT sum(http.requests.count) WHERE region='us-east-1' and timestamp>=now()-1 hour
To execute this query, the database first needs to identify the time-series that satisfy the filter region='us-east-1' and then aggregate them via sum function. Reading all the tags and finding relevant entries would be computationally expensive, thus TSDB’s usually use inverted indexes to mitigate full table scans.

Each unique tag pairs are associated with time series id’s.
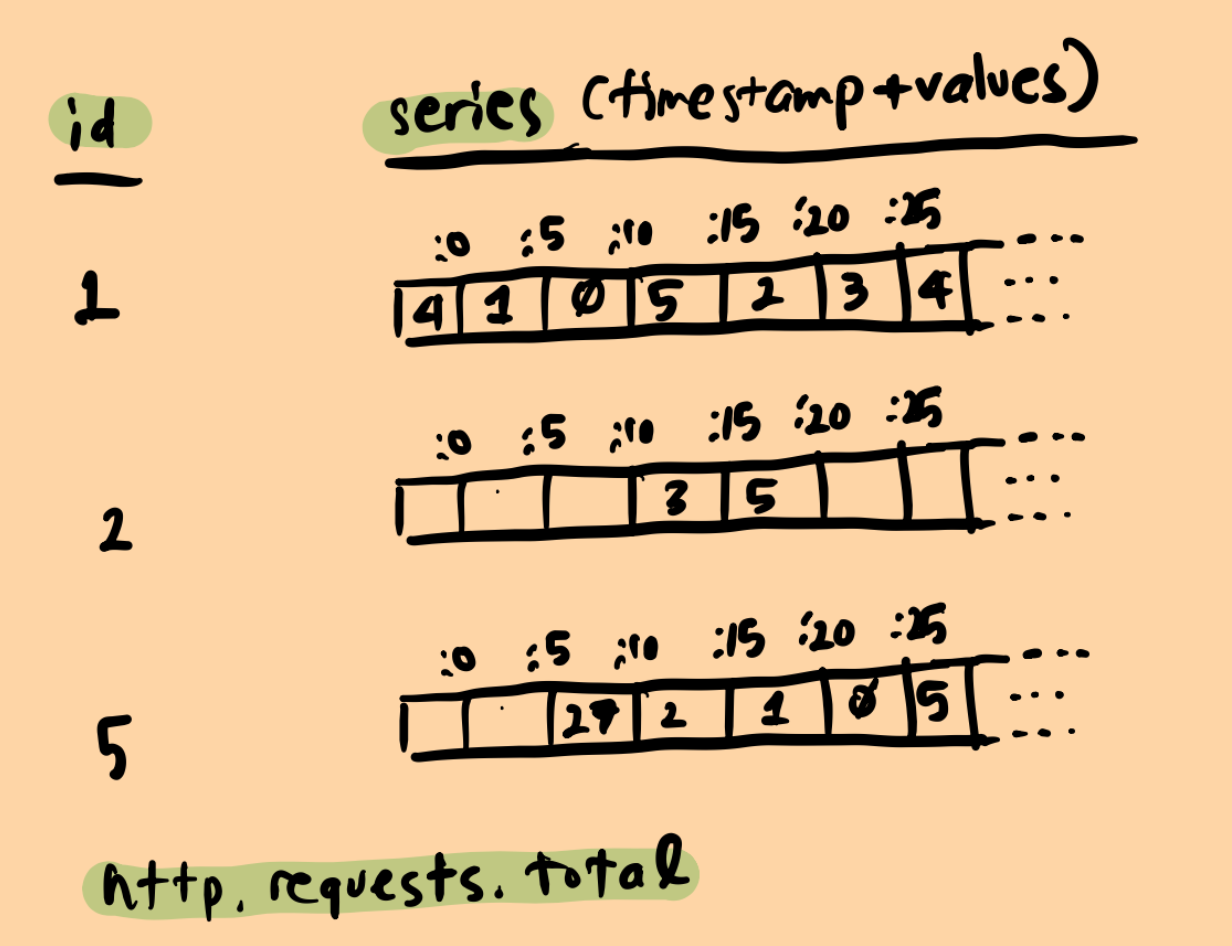
And then each time series is just an array of metric measurements(values) that happen in a specified interval. For instance, in above example, the number of http requests are bucketed into 5 second windows.
Now, there is lots of additional complexity to make the time-series indexing efficient which I don’t want to go into detail. But there is an excellent post on the subject on how Datadog does that if you are interested.
If you follow closely, storing data as time-series has a major drawback: each unique tag list means a unique time-series. For instance, if tags contain a high-cardinality field like request-id, each unique request-id will generate a unique time-series which leads to combinatorial explosion of storage requirements. This is a fundamental problem in time-series datastores, famously named “cardinality explosion”.
There is no easy solution to this problem rather than just capping certain value combinations.
Moreover, to our luck, the most valuable queries often involve high-cardinality data—datasets with numerous unique values such as user IDs, container IDs, or hostnames. True observability lets us query our datastore freely, without constraints from its structure or details. These ad-hoc queries should execute efficiently, ideally yielding results in a matter of seconds, to maintain the fluidity of troubleshooting and iterative debugging.
Do not get me wrong—TSDBs have unique benefits, particularly for managing metrics:
- Compression: Extensive research has been done on efficient storage for time-series data. The Gorilla paper is a notable example.
- Downsampling and Aggregation: Thanks to their data structure, TSDBs make these operations remarkably simple.
- Write Efficiency: Appending data to existing time series becomes very fast.
While time-series databases represent an important milestone in telemetry management, modern telemetry data and true observability simply demands more flexible architectures, leading us to the realization that there is no perfect architecture—only emerging patterns tailored to specific challenges.
No Silver Bullet, Just Emerging Patterns
Until here, we have been describing various challenges in building an observability pipeline, detailing the telemetry data and functional requirements of the system and where the traditional storage systems, particularly Time Series databases fall short.
Next, we’ll shift focus to a high-level overview of observability pipeline infrastructure and the common patterns used to build it. Be warned, though: as with much of software engineering, there’s no silver bullet. Yet, there are widely adopted, emergent patterns that many observability pipelines share.
In fact, these common patterns often arise because systems cross-pollinate over time, learning from each other’s successes and failures.
Drawing inspiration from established, battle-tested systems is a common practice in tech. For instance, it’s no secret that Datadog’s Husky was inspired by Google’s Procella and Snowflake, while Honeycomb’s Retriever drew inspiration from Facebook’s Scuba.
Let’s take a broader view and attempt to identify the common denominator components these systems share:
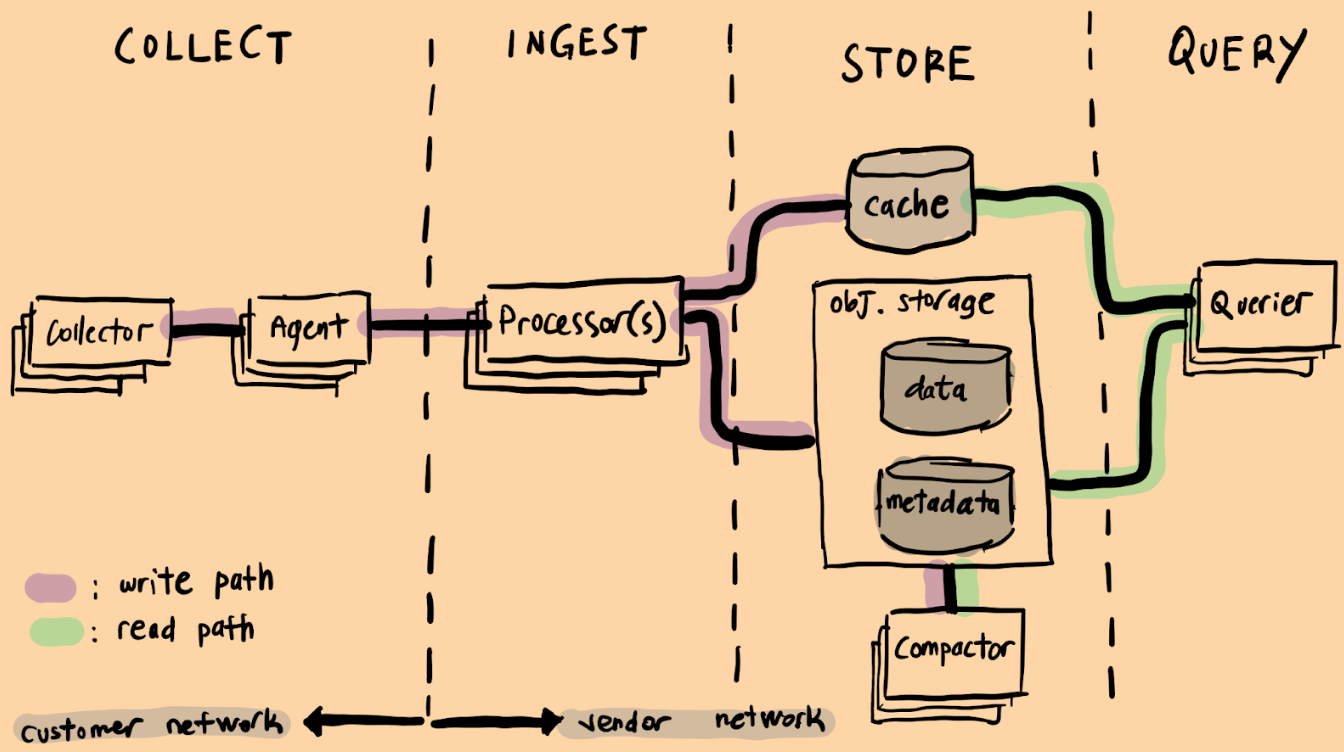
There are four basic stages in a modern observability pipeline. In fact, most modern OLAP databases employ similar architecture.
We will explore the stages step-by-step, moving from left to right, while highlighting the key patterns and design choices applied at each point.
Collection
Collection stage happens in customer’s network and is where the telemetry data is gathered and forwarded to the observability pipeline backend.
Pattern 1: Powered by OpenTelemetry®
OpenTelemetry is the defacto for the collection. Period.
In fact, it is not only solving the problem of collecting data, it does much much more. Maybe even a bit too much. But there is no debate that it is the past present and future of collection and storage of telemetry data. Backed by the CNCF, OpenTelemetry has already seen widespread adoption from nearly all major players in the industry.
There is the famous three pillars of telemetry being logs, metrics and traces, but there is a recent push on more signals like Continuous Profiling and maybe even RUM (Real User Monitoring) – although RUM will probably be based on existing signals like traces.
Let’s also mention that OpenTelemetry Collector is a single Go binary that can be customized and plays a critical role in the deployment of OpenTelemetry stack. I don’t want to go into details on the specifics of the Collector as there is already a massive information on what it does and how it can be deployed.
Ingestion
The ingestion stage is responsible for receiving telemetry data, performing any necessary transformations, and forwarding it for storage.
In a distributed system, especially at scale, anything can fail anytime. As mentioned before, observability workloads are extremely write-heavy. This means any failure during ingestion stage can lead to data loss. While losing a few metrics or logs might seem acceptable at first glance, in an observability system, even a single missing telemetry signal could trigger a critical alert. Therefore, data loss is not an option. The ingestion pipeline must be fault tolerant at every step until data makes it to the storage layer.
Availability is also crucial, as there may be SLAs to be met. For instance, DataDog claims to provide %99.8 availability.
These requirements make ingestion phase inherently complex and critical, which explains why vendors have embraced diverse strategies to address its challenges.
Yet, common patterns still do emerge.
Pattern 2: The Mighty Message Queue
Using a message queue in the Ingestion layer solves a hell of a lot of complex, distributed system problems ranging from fault tolerance, consistency to scalability and availability. That is the key reason why big observability vendors have been using Kafka heavily in their ingestion pipelines.
Ben Hartshorne from Honeycomb even has a famous saying:
Kafka is the “beating heart” of Honeycomb, powering our 99.99% ingest availability SLO
I have zero intention of going internals of Kafka in this blog post. But to put it briefly: Kafka is essentially a distributed log system. A producer receives the telemetry data and quickly forwards it to a Kafka topic. The, a consumer reads messages from the topic, processes them, and forwards them to storage.
My aim is to show some of the capabilities a message queue like Kafka has to offer:
Horizontal Scalability: Producers and consumers remain mostly stateless, allowing them to be easily scaled up or down. Kafka seamlessly handles all the coordination, rebalancing, and consensus behind the scenes, making it appear as though horizontal scalability is achieved simply by adding more resources.
Fault Tolerance: Any crash or overload in the producer might trigger a retry or timeout on the Agent. Once the data is written to the message queue, it becomes the responsibility of the message queue. Kafka, for instance, is known for its robust durability guarantees, even under adverse conditions like crashes or overloads.
On the consumer side, the workflow begins by reading data from the message queue and ends with writing it to the storage layer.
Some form of buffering may be necessary before completing the write for fault tolerance reasons. This is especially important if the storage layer relies on object stores, as each PUT operation incurs a cost.
While buffering addresses cost concerns, it introduces a new challenge—what happens if the consumer or message queue crashes? Buffered data risks being lost during a restart. The solution? Implement a strategy that delays removing buffered data until it is successfully written to object storage. If a crash occurs, the consumer can replay the data from Kafka, which serves as a WAL (Write-Ahead Log) —a concept widely used in database systems to ensure data integrity.
Write Distribution: Writes are performed on topics, which are partitioned to enable horizontal scaling. For example, Honeycomb used(it might have changed) random partitioning across Kafka topics to achieve write distribution. Custom partitioning strategies—such as partitioning by customer ID—are also used for more controlled write distribution; Datadog’s Husky also employs a flavor of this approach.
However, this is not as straightforward as it sounds. A single customer’s data can easily exceed the limits of a single topic, requiring vendors to implement various strategies to handle this challenge. This topic, on its own can have its own blog post, so I am leaving it as is for now.
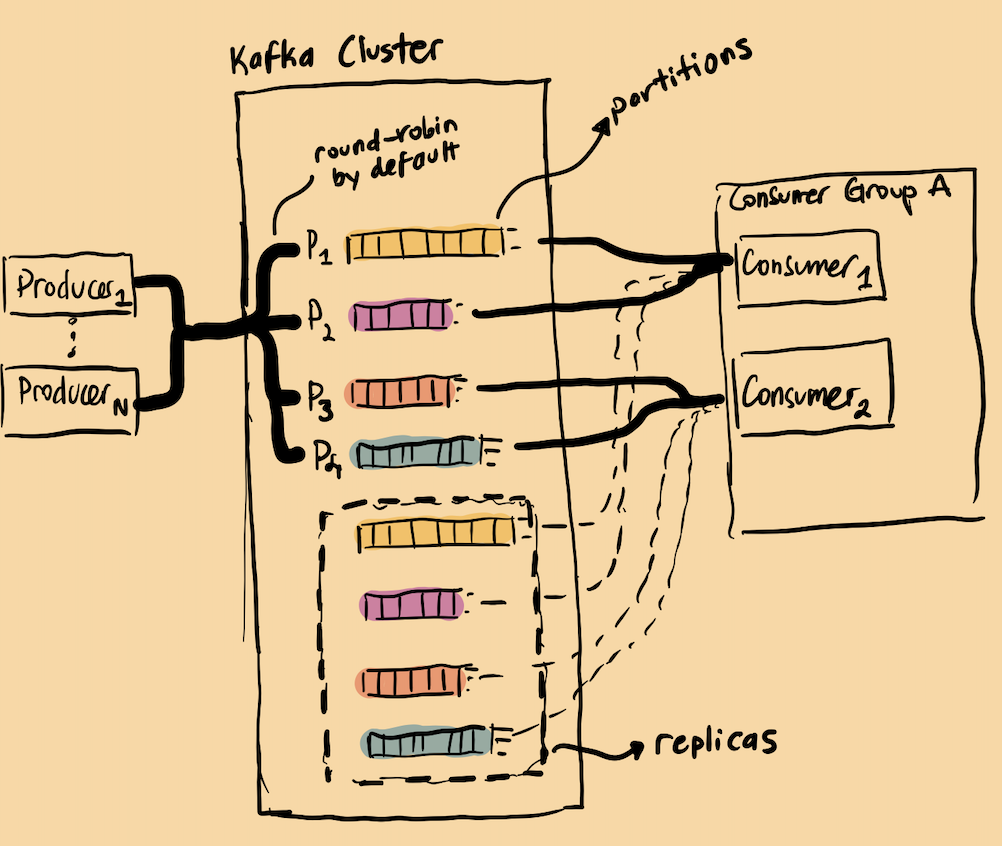 An old, clumsy sketch of mine I used while teaching myself Kafka
Replication: Replication becomes such an easy concept when a message queue like Kafka is used. As an example, in Honeycomb’s Retriever implementation, the incoming telemetry data is basically replicated to 2 brokers at write time and the same partition is consumed from multiple consumer groups. All of this is achieved through simple configuration.
Backpressure: There’s an excellent article by Richard Artoul on backpressure that I’d like to quote to explain the concept:
At its core, backpressure is a really simple concept. When the system is nearing overload, it should start “saying no” by slowing down or rejecting requests.
In our context, this means the system should slow down or reject successful responses until the data is successfully written to the message queue. Consequently, messages will be buffered on the Agent or application until they are ingested successfully. This is where the principle that “clients are a crucial part of any distributed system” comes into play. Backpressure must be managed seamlessly from downstream all the way up to upstream components.
Streaming: A message queue can also be used in real-time stream processing architectures. While not every message queue supports streaming database functionalities, Kafka allows applications to process data as it arrives, enabling use cases like real-time alerting systems.
With tools like Kafka Streams or ksqlDB, streaming analytics, and transformation can be applied to fresh data as it flows through the system. Streaming capabilities can also be used to analyze traffic patterns of tenants to make clever decisions on more efficient distribution of bursty writes.
We mentioned a whole lot of Kafka and how it is used in a real-world observability pipeline. However, it is not the only solution.
For instance, Grafana has implemented their own set of components to handle the problems mentioned. If you look closely though, you will see many similar patterns are implemented in these components that are also implemented in Kafka. Just to name few: write quorums and WAL are used to achieve fault tolerance and replication, being stateless to achieve scalability and Consistent Hash Rings to achieve high availability…etc.
Using a Message Queue, while beneficial in many ways, comes with significant operational costs and complexity. Scaling a multi-tenant observability workload with Kafka requires specialized skills and experience.
However, recent tools like Warpstream and Bufstream appear to fulfill their promise of reducing operational complexity and costs by leveraging commodity object storage.
If I were to start an Observability company today, I would seriously consider these as a Kafka alternative.
Storage
Storage phase is all about where telemetry data stays at rest.
As we have seen, observability data is immutable. It is written only once but read many times and often in high volumes. Thus, we should do our best to transform the received telemetry data in such a way that is optimized for efficient reads.
Pattern 3: DB-nomics: Object Storage for Database Economics
Db-nomics (Database economics) plays a critical role in storing and querying observability data, which is typically stored in large volumes for long retention periods but is rarely accessed.
Moreover, it is not uncommon to read GBs or even TBs of data for a single query. Traditional block storage like EBS or any pre-allocated storage quickly becomes unfeasible due to the cost implications of bursty and massive traffic volumes, both for writes and reads.
Consequently, object stores become a natural sweet spot for observability vendors providing the best durability guarantees while still being cheap.
However, it would be unfair to attribute these characteristics solely to observability workloads. Various industries, such as finance and genetics, and many more has already a strong trend toward utilizing cloud object stores in data warehouses like Snowflake, Amazon Redshift, and Databricks.
Additionally, a recent paper “Exploiting Cloud Object Storage for High-Performance Analytics,” delves into the workings, limitations, and cost-effective usage of cloud object stores for analytical workloads.
Nothing is pink clouds, though. Object stores also have their own challenges:
Latency: It is roughly ~4x times cheaper on S3 than to store the same bits on a block storage like EBS SSD.
But the latency is higher, maybe up to ~100x compared to EBS.
To saturate the bandwidth, you need to make concurrent requests and optimize your query engine to make many simultaneous data retrieval requests. A typical
GETrequest has an average of ~30ms TTFB(time to first byte) with throughput averaging around ~50Mb/s.Pricing model: Unsurprisingly, Cloud object storage pricing models charge per API request and data retrieval, making the number and size of requests critical factors in controlling costs. You need to maximize throughput but minimize object store requests.
Moreover, cross-region data transfer costs can be significant. It is crucial that you design your system that compute and storage nodes stay in same region for example to benefit from free inter-region costs.
Pricing model is such a dictating factor in designing datastores on top of object storage. Another example of this is how fast decompression often takes priority over better compression since storage is cheap, but compute is not.
Variability in Throughput and Latency: It’s fairly common to encounter lost requests or unusually high tail latencies. For instance, a first byte average latency ~80ms is common but fewer than ~5% of requests exceeding ~200ms. To mitigate these issues, techniques like request hedging are essential. We will probably revisit this strategy in detail in the Query Execution section.
Balance of Data Retrieval and Query Processing: You should maximize the throughput via concurrency without wasting CPU cycles. If you wait too long for data to arrive, the CPU becomes idle and underutilized. On the other hand, retrieving too much data can overwhelm the CPU, leading to a backlog and overutilization.
Metadata and Indexing: Object store nature means there’s no inherent way to index data as with traditional databases or file systems.
This can create inefficiencies in querying large datasets unless you design a metadata layer or indexing strategy that complements your data access patterns.
Maximizing filtering is crucial, as each object access incurs a cost.
Fortunately, there is lots of recent improvements in this area, such as Apache Iceberg, Apache Parquet, S3 Tables and Metadata… These projects and open formats aim to bridge the gap by providing a robust metadata layer for managing the vast amounts of data stored in object storage.
To name a few real world examples: ClickHouse Cloud, InfluxDB and SnowFlake are analytical databases built on top of object storage. In the observability space, Honeycomb’s Retriever, Datadog’s Husky, and Grafana’s Loki, Tempo, and Mimir all support storing data in object storage.
Additionally, at Monitorama 2024, Netflix gave a notable tech talk on how they implemented a unified observability data lake on S3, handling a wide range of signals such as metrics, logs, traces, profiles, RUM, and even NetFlow.
WarpStream is also worth mentioning—it’s a Kafka protocol-compatible streaming database that operates fully on object storage and was recently acquired by Confluent. The technical details behind WarpStream’s development are particularly interesting, especially considering its founders are ex-Datadog engineers.
Pattern 4: Decoupling Compute and Storage
Disaggregation is a recent and widespread trend in database architectures. It extends beyond just compute and storage separation to include internal components such as the Write-Ahead Log (WAL) and query parsers. The rise of open data formats like Apache Iceberg and Apache Hudi further exemplifies this trend, highlighting a shift towards modular and interoperable systems.
According to this post from Chris Riccomini, Hadoop has started the flame years ago:
Eighteen years ago, Hadoop broke the data warehouse into compute, data, and control planes—a paradigm that persists to this day.
Chris then delves into the chronological history of the component disassembly. It is a highly recommended read.
In this post, however, I will focus exclusively on compute and storage segregation, as it is a prevalent pattern in telemetry pipelines.
The core idea is simple: separate the nodes used for computation from those used for storage. This separation allows independent scaling of each resource to optimize usage. For example, compute nodes can be high-performance machines with powerful CPUs, high-bandwidth connections, and minimal local storage.
As mentioned earlier, leveraging commodity object stores has emerged as a popular pattern for storing telemetry data, primarily due to cost benefits. This approach inherently results in the segregation of compute and storage. A notable example is Honeycomb’s Retriever, which shards high-volume data stored on S3 and utilizes serverless infrastructure to horizontally scale query execution for processing large datasets. They also highlight significant cost benefits from using ARM-based machines.
Pattern 5: Column Oriented Storage
Typical OLTP(Online Transactional Processing) workloads excel at transactional processing, handling operations like CRUD (Create, Read, Update, Delete). These queries often operate on multiple rows, which may be scattered across different locations on disk. This workload is akin to “needle-in-a-haystack” queries, where the goal is to quickly find specific data points amidst a large dataset.
In contrast, OLAP(Online Analytical Processing) workloads specialize in read-heavy aggregations, focusing on reading large volumes of rows and summarizing them. This data access pattern closely mirrors that of observability queries, making OLAP databases an ideal choice for such workloads, as detailed in the above section: Anatomy of Telemetry Data.
Moveover, in a typical analytical query, you often read many rows (or data points) but only a few columns. This workload is significantly more efficient when using a columnar format, as it minimizes unnecessary data retrieval. This is the key reason why OLAP databases typically employ a columnar format for data storage.
A notable example is found in the original Dremel paper, where Google experimented with storing data in both columnar and record-oriented formats. The results were striking: query latencies dropped from hours to minutes when using columnar storage.
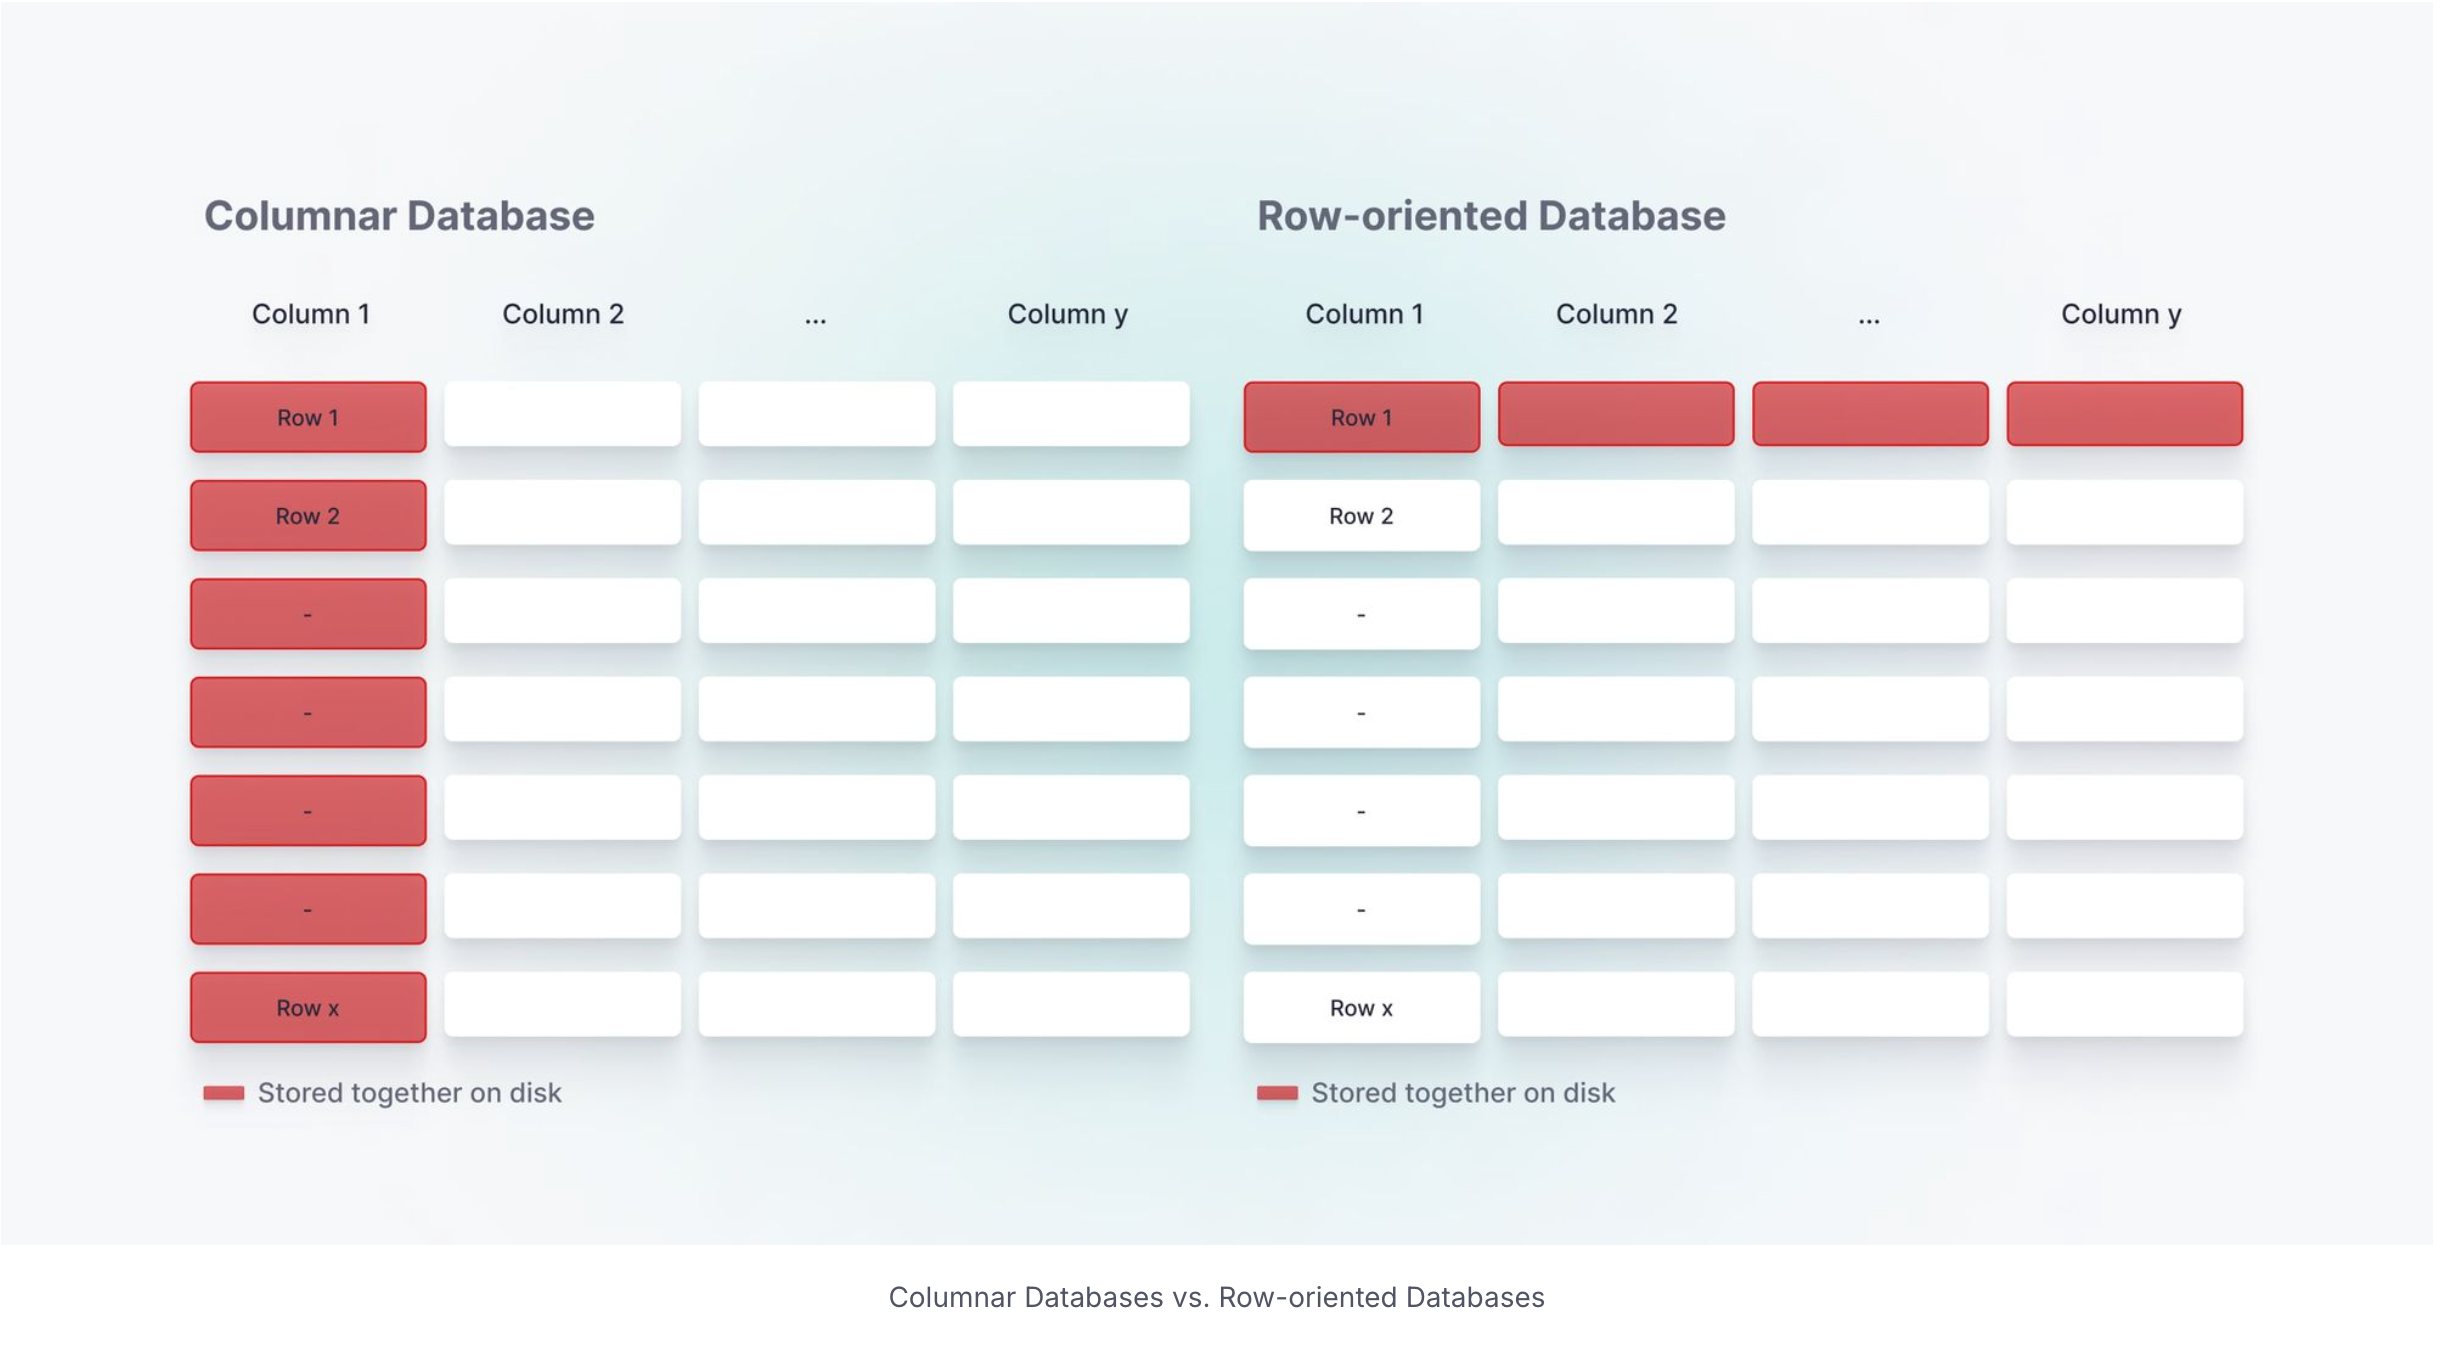 Image credit: https://www.tinybird.co/blog-posts/what-is-a-columnar-database
Storing data in a column-oriented fashion provides several benefits:
Compression: Compressing data at the column level offers significant benefits, as data within a column is often repetitive and semantically similar. This reduces storage requirements and has compounding advantages, such as lowering the I/O workload per query and minimizing data transfer overhead which usually dominate the overall costs.
Data Locality: Storing columns closely together improves data locality, which is particularly beneficial when data is accessed in the same order as it is stored. This is because Modern CPUs are cache beasts, and better data locality directly translates to better cache utilization and thus faster data processing.
Vectorized Execution: Most CPUs can leverage SIMD(Single Instruction, Multiple Data) instructions for performance optimization, and many OLAP databases support vectorized execution to take advantage of this capability.
Vectorized execution is particularly effective in columnar storage formats, thanks to the data locality. This allows CPUs to process contiguous data blocks more efficiently, minimizing memory access latency and maximizing throughput.
Recent Improvements: Apache Parquet has emerged as the de facto file format for storing columnar data. Complementary projects like Apache Arrow and Apache Iceberg are rapidly evolving, gaining significant traction and support from most analytical databases. These open file formats make it much easier to store data in a columnar format and experiment with tools like ClickHouse or DuckDB.
In addition to the advantages of columnar formats, modern analytical databases also offer unique benefits for observability workloads that comes for free:
Data retention is supported out-of-the-box. As a real world example: Clickhouse supports TTL for removing historical data very easily by partitioning the data in a way for easier deletion.
The immutable nature of telemetry data further facilitates efficient write-time aggregations. Most serious analytical databases excel at these operations, often leveraging materialized views to optimize performance. By utilizing materialized views, you can also easily implement a common practice in telemetry data pipelines: downsampling. This allows you to aggregate data points into buckets of any desired interval, such as 1 minute, 5 minutes, or more, simplifying data analysis and reducing storage overhead.
Query Execution
I did not forget this section :) To be hopefully continued in Chapter 2.
Ending Words
There is much more patterns than I listed here, probably even more than I know of. As an example: we did not even touch Query Execution section at all.
I am planning to do a Chapter 2 of this post if when I find time.
Stay tuned! :)